






ehrapy: electronic health record (EHR) analysis in Python
ehrapy is an open-source Python framework for exploratory and statistical analysis of electronic health records (EHR) and other clinical and epidemiological data.
It reads static and longitudinal patient data from OMOP databases, public datasets such as MIMIC and PhysioNet, or your own tables.
It is for clinical researchers, epidemiologists and data scientists who want to go from raw patient data to quality-controlled cohorts, patient groups, trajectories, statistical tests, survival curves and treatment effect estimates in one reproducible workflow.
With ep.ml, it also trains and evaluates prediction models on the same data, from gradient boosting to recurrent and transformer networks, with patient-level splits, calibration and subgroup metrics.
Installation
You can install _ehrapy_ via [pip] from [PyPI]:
$ pip install ehrapyOptional extras enable dask-backed out-of-core arrays (ehrapy[dask]), Leiden clustering (ehrapy[leiden]), deep learning prediction models (ehrapy[ml]), and GPU acceleration through rapids-singlecell (ehrapy[rapids12] or ehrapy[rapids13]).
Quickstart
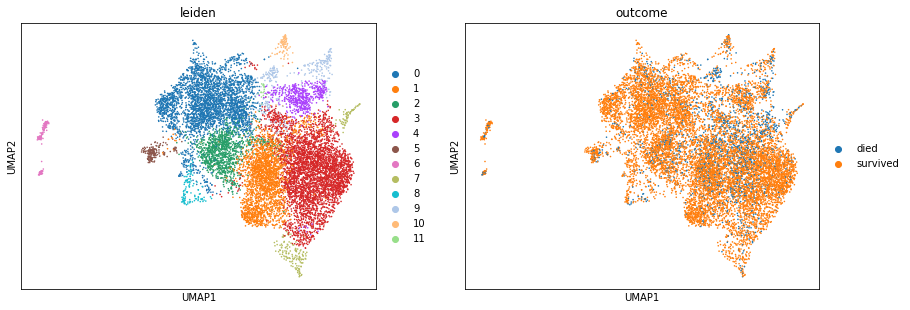
Cluster 11,988 intensive care stays from PhysioNet 2012, each with 37 measurements over 48 hours, and test which measurements differ between patients who died and survived, after pip install "ehrapy[leiden]":
import ehrdata as ed
import ehrapy as ep
edata = ed.dt.physionet2012()  # 11,988 ICU stays × 37 measurements × 48 hours
ed.infer_feature_types(edata)
ep.pp.locf_impute(edata)
ep.pp.scale_norm(edata)
summary = ep.pp.summarize_measurements(edata, statistics=["mean", "min", "max"])
summary.obs["outcome"] = summary.obs["In-hospital_death"].map({0: "survived", 1: "died"}).astype("category")
ep.pp.pca(summary)
ep.pp.neighbors(summary)
ep.tl.leiden(summary, resolution=0.3)
ep.tl.umap(summary)
ep.pl.umap(summary, color=["leiden", "outcome"])
ep.tl.rank_features_groups(summary, groupby="outcome", groups=["died"], reference="survived")
ep.get.rank_features_groups_df(summary, group="died")[["names", "scores", "pvals_adj"]].head()
names     scores      pvals_adj
0    GCS_mean -28.216665  1.869927e-146
1     GCS_max -22.782927  1.980853e-100
2    BUN_mean  18.654604   3.497719e-70
3     BUN_min  18.486603   2.324785e-69
4  Urine_mean -16.941847   1.399260e-59
Documentation
The documentation has the tutorials and the API reference.
Citation
Read more about ehrapy in the associated publication.
@article{Heumos2024,
  author = {Heumos, Lukas and Ehmele, Philipp and Treis, Tim and Upmeier zu Belzen, Julius and Roellin, Eljas and May, Lilly and Namsaraeva, Altana and Horlava, Nastassya and Shitov, Vladimir A. and Zhang, Xinyue and Zappia, Luke and Knoll, Rainer and Lang, Niklas J. and Hetzel, Leon and Virshup, Isaac and Sikkema, Lisa and Curion, Fabiola and Eils, Roland and Schiller, Herbert B. and Hilgendorff, Anne and Theis, Fabian J.},
  year = {2024},
  month = {11},
  day = {01},
  title = {An open-source framework for end-to-end analysis of electronic health record data},
  journal = {Nature Medicine},
  volume = {30},
  number = {11},
  pages = {3369--3380},
  issn = {1546-170X},
  doi = {10.1038/s41591-024-03214-0},
  url = {https://doi.org/10.1038/s41591-024-03214-0}
}
[pip]: https://pip.pypa.io/ [pypi]: https://pypi.org/