
6 Nov 2026
The AI sell-off compared to well-known stock market crashes
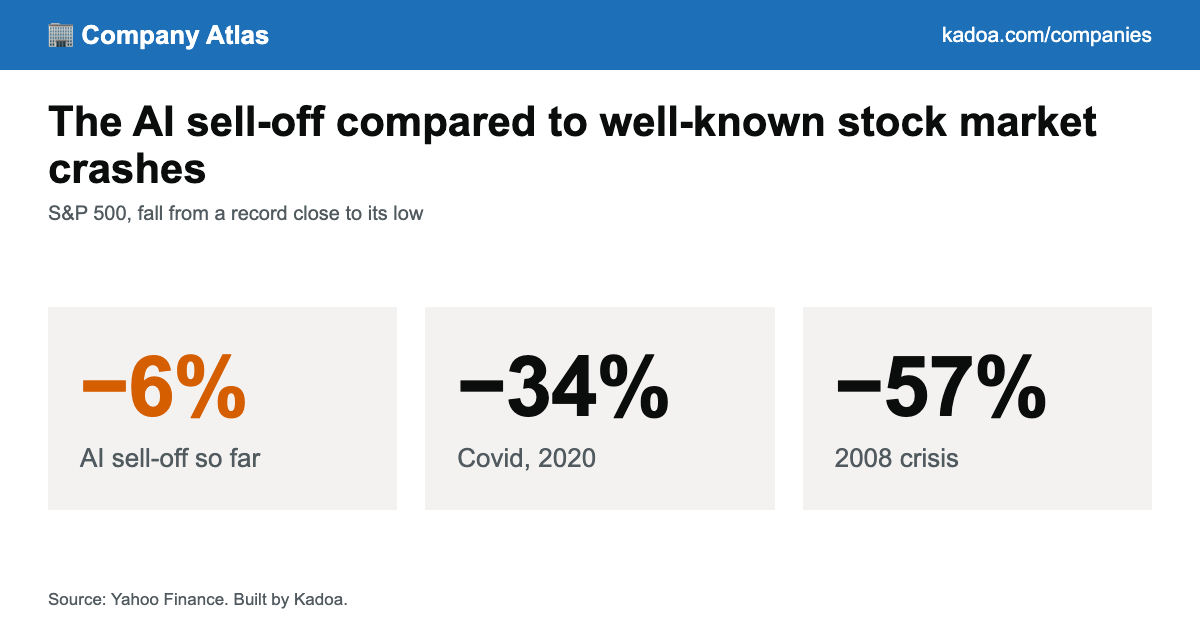
The S&P 500 is 6% below its record, a small fall next to past crashes: since 1928, only 16 of 56 drops that reached 6% went past 15%. Tech took more of the hit. The Nasdaq is 11% down and US chip stocks 36%, as deep as their Covid fall. How long a recovery takes varies just as much: after dot-com, the S&P 500 was back at its record in 7 years, chip stocks in 18.
The S&P 500 at the close on 6 Nov 2026
- Below record
- −6%
- From its record close
- Thursday 5 Nov
- −4.4%
- Worst day since 4 Apr 2025
- Trading days since record
- 23
- Since 6 Oct 2026
- Slides that went past 15%
- 16 of 56
- Slides since 1928 that reached 6%
How far the S&P 500 fell below a record close
Each line runs from a record high to the low that followed. Eight of the 16 falls past 15% since 1928 are shown.
Daily closes to 6 Nov 2026
| Fall | Record close | Below record | Trading days | Back at record |
|---|---|---|---|---|
| AI sell-off | 6 Oct 2026 | −5.7% | 23 | Not yet |
| April 2025 | 19 Feb 2025 | −18.9% | 34 | 27 Jun 2025, 4 months |
| 2022 | 3 Jan 2022 | −25.4% | 195 | 19 Jan 2024, 2.0 years |
| Covid | 19 Feb 2020 | −33.9% | 23 | 18 Aug 2020, 6 months |
| 2008 crisis | 9 Oct 2007 | −56.8% | 355 | 28 Mar 2013, 5.5 years |
| Dot-com | 24 Mar 2000 | −49.2% | 637 | 30 May 2007, 7.2 years |
| 1987 crash | 25 Aug 1987 | −33.5% | 71 | 26 Jul 1989, 1.9 years |
| 1973 oil shock | 11 Jan 1973 | −48.2% | 436 | 17 Jul 1980, 7.5 years |
| Great Depression | 16 Sep 1929 | −86.2% | 678 | 22 Sep 1954, 25.0 years |
Mild for the S&P 500, a crash for chip stocks
How far each index is below its record now, against the lows of its own best-known past falls. US chip stocks (the PHLX Semiconductor index) are 36% down from their 22 Jun record, as deep as their Covid fall.
Daily closes to 6 Nov 2026
| Index | Below record now | Past falls |
|---|---|---|
| S&P 500 | −5.7% since 6 Oct 2026 | April 2025 −18.9%, 2022 −25.4%, Covid −33.9%, 2008 −56.8%, Great Depression −86.2% |
| Nasdaq | −10.9% since 6 Oct 2026 | April 2025 −24.3%, Covid −30.1%, 2022 −36.4%, 1973 −59.9%, Dot-com −77.9% |
| US chip stocks | −35.8% since 22 Jun 2026 | Covid −35.0%, April 2025 −39.7%, 2022 −46.5%, Dot-com −87.2% |
After dot-com, the S&P 500 took 7 years to recover, chip stocks 18
Years from each index's record close to its first close back at or above it. Prices only: with dividends reinvested, most recoveries were shorter. These are worst cases, for someone who bought at the record.
| Crash | Index | Back at record |
|---|---|---|
| Great Depression | S&P 500 | 22 Sep 1954, 25.0 years |
| Great Depression | Nasdaq | Before index |
| Great Depression | US chip stocks | Before index |
| 1973 oil shock | S&P 500 | 17 Jul 1980, 7.5 years |
| 1973 oil shock | Nasdaq | 7 Sep 1978, 5.7 years |
| 1973 oil shock | US chip stocks | Before index |
| 1987 crash | S&P 500 | 26 Jul 1989, 1.9 years |
| 1987 crash | Nasdaq | 3 Aug 1989, 1.9 years |
| 1987 crash | US chip stocks | Before index |
| Dot-com | S&P 500 | 30 May 2007, 7.2 years |
| Dot-com | Nasdaq | 23 Apr 2015, 15.1 years |
| Dot-com | US chip stocks | 21 Nov 2017, 17.7 years |
| 2008 crisis | S&P 500 | 28 Mar 2013, 5.5 years |
| 2008 crisis | Nasdaq | Inside dot-com |
| 2008 crisis | US chip stocks | Inside dot-com |
| Covid | S&P 500 | 18 Aug 2020, 6 months |
| Covid | Nasdaq | 8 Jun 2020, 4 months |
| Covid | US chip stocks | 5 Jun 2020, 3 months |
| 2022 | S&P 500 | 19 Jan 2024, 2.0 years |
| 2022 | Nasdaq | 29 Feb 2024, 2.3 years |
| 2022 | US chip stocks | 14 Dec 2023, 2.0 years |
| April 2025 | S&P 500 | 27 Jun 2025, 4 months |
| April 2025 | Nasdaq | 27 Jun 2025, 6 months |
| April 2025 | US chip stocks | 10 Sep 2025, 1.2 years |
About the data
- The S&P 500 is the price index, without dividends, from daily closes on Yahoo Finance. Before March 1957 the series is its predecessor, the S&P 90.
- A fall runs from a record close to the next record, so the 2011 fall sits inside the 2007 to 2013 one. Its depth is the lowest close before the next record.
- "AI sell-off" is our name for the slide since the 6 October 2026 record.